Analisis Jaringan dengan NetworkX: Memetakan Hubungan dalam Data Graph

Banyak masalah dunia nyata dapat direpresentasikan sebagai graph: jaringan sosial, infrastruktur transportasi, atau interaksi protein dalam biologi. NetworkX adalah library Python yang menyediakan tools lengkap untuk membuat, memanipulasi, dan menganalisis struktur graph dengan efisien.
Memahami Struktur Graph
Graph terdiri dari dua komponen utama: nodes (titik/vertex) dan edges (garis/sisi). Nodes merepresentasikan entitas seperti orang, lokasi, atau objek. Edges merepresentasikan hubungan atau koneksi antar entitas tersebut.
Terdapat dua jenis graph utama. Undirected graph memiliki edges tanpa arah: hubungan bersifat mutual seperti pertemanan di Facebook. Directed graph memiliki edges dengan arah tertentu seperti hubungan follow di Twitter. NetworkX mendukung keduanya melalui Graph() dan DiGraph().
NetworkX juga menangani weighted graph di mana setiap edge memiliki nilai bobot, serta multigraph yang memperbolehkan multiple edges antar pasangan nodes yang sama.
Instalasi dan Setup
NetworkX dapat diinstall dengan pip. Library ini pure Python sehingga tidak memerlukan dependencies kompleks.
!pip install networkx matplotlib

import networkx as nx
import matplotlib.pyplot as plt
Kita juga mengimport matplotlib untuk visualisasi graph. NetworkX sendiri fokus pada komputasi dan struktur data, sementara visualisasi diserahkan ke library eksternal.
Membuat Graph Dasar
NetworkX menawarkan beberapa cara untuk membuat graph. Kita dapat memulai dari graph kosong dan menambahkan nodes serta edges secara manual.
# Membuat undirected graph kosong
G = nx.Graph()

# Menambahkan nodes
G.add_node(1)
G.add_nodes_from([2, 3, 4, 5])

# Menambahkan edges
G.add_edge(1, 2)
G.add_edges_from([(2, 3), (3, 4), (4, 5), (5, 1), (1, 3)])

# Informasi graph
print(f"Nodes: {G.number_of_nodes()}")
print(f"Edges: {G.number_of_edges()}")
Output:
Nodes: 5
Edges: 6
Method add_nodes_from() dan add_edges_from() menerima iterable, memungkinkan penambahan multiple elements dalam satu call. Untuk graph dengan struktur yang lebih kompleks, NetworkX menyediakan fungsi generator seperti nx.complete_graph(), nx.path_graph(), dan nx.random_graphs.erdos_renyi_graph().
Visualisasi Graph
Visualisasi membantu memahami struktur dan pola dalam graph. NetworkX mengintegrasikan layout algorithms untuk menentukan posisi nodes secara otomatis.
# Menggunakan spring layout
pos = nx.spring_layout(G, seed=42)
plt.figure(figsize=(8, 6))
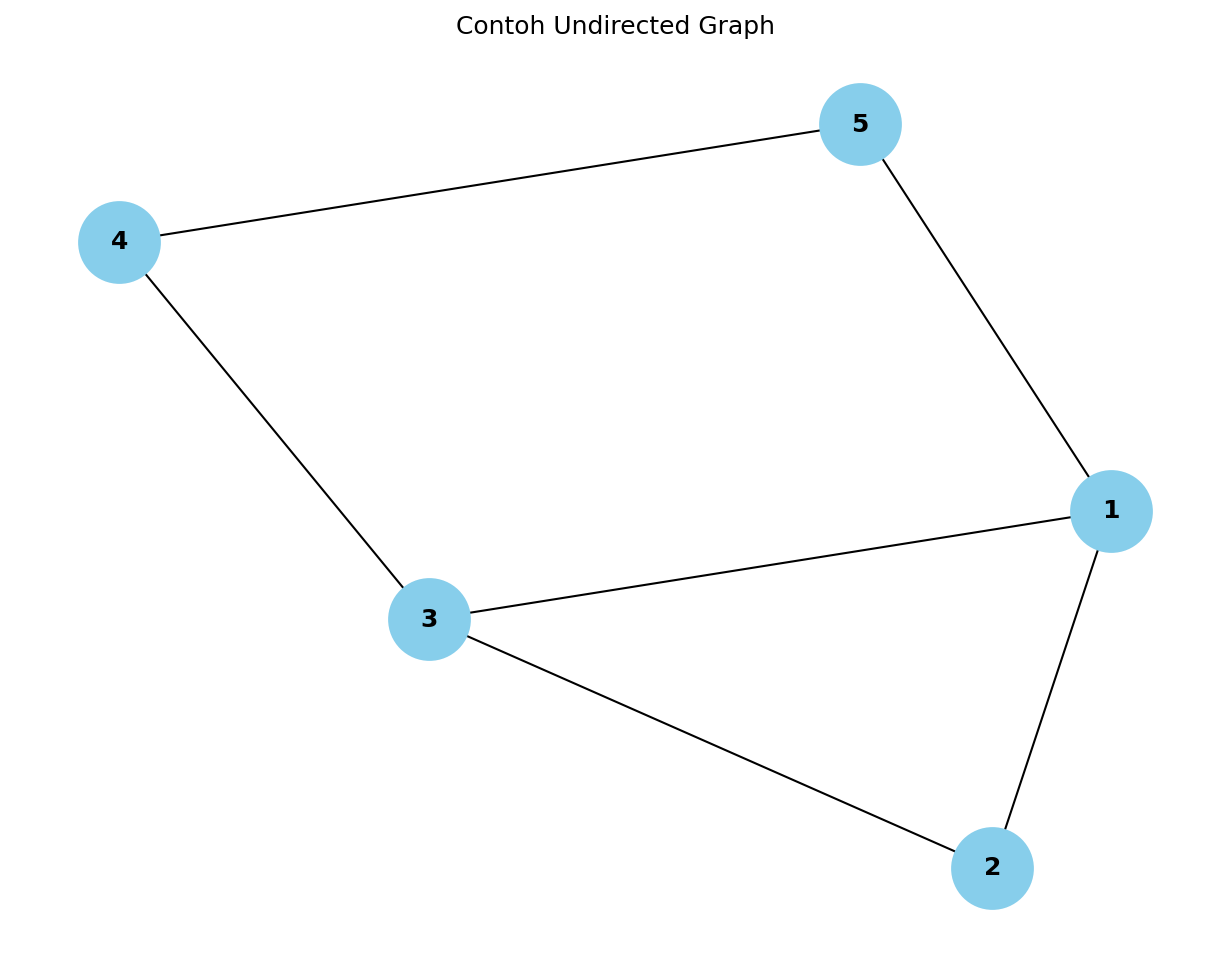
nx.draw(G, pos, with_labels=True, node_color='skyblue',
node_size=1500, font_size=12, font_weight='bold')
plt.title("Contoh Undirected Graph")
plt.show()Output:
Layout spring_layout() menggunakan force-directed algorithm: nodes saling menolak sementara edges menarik nodes yang terhubung. Parameter seed memastikan hasil reproducible. NetworkX juga menyediakan layout alternatif seperti circular_layout(), random_layout(), dan shell_layout().
Analisis Centrality
Centrality metrics mengukur importance atau influence dari nodes dalam graph. NetworkX menyediakan berbagai algoritma untuk perhitungan ini.
Degree centrality menghitung jumlah koneksi langsung yang dimiliki node. Nodes dengan degree tinggi adalah hub yang terhubung ke banyak nodes lain.
# Degree centrality
degree_cent = nx.degree_centrality(G)
print("Degree Centrality:", degree_cent)
Data Science with Python
Master the art of data analysis, visualization, and predictive modeling.
Output:
Degree Centrality: {1: 0.75, 2: 0.5, 3: 0.75, 4: 0.5, 5: 0.5}Betweenness centrality mengukur seberapa sering node berada di jalur terpendek antar pasangan nodes lain. Nodes dengan betweenness tinggi berperan sebagai bridge atau gatekeeper dalam jaringan.
# Betweenness centrality
betweenness_cent = nx.betweenness_centrality(G)
print("Betweenness Centrality:", betweenness_cent)
Output:
Betweenness Centrality: {1: 0.25, 2: 0.0, 3: 0.25, 4: 0.08333333333333333, 5: 0.08333333333333333}Closeness centrality mengukur rata-rata jarak dari suatu node ke semua nodes lain. Nilai tinggi menunjukkan node dapat mencapai nodes lain dengan cepat.
# Closeness centrality
closeness_cent = nx.closeness_centrality(G)
print("Closeness Centrality:", closeness_cent)
Output:
Closeness Centrality: {1: 0.8, 2: 0.6666666666666666, 3: 0.8, 4: 0.6666666666666664, 5: 0.6666666666666666}Analisis Community dan Clustering
Graph sering mengandung communities atau clusters: grup nodes yang saling terhubung erat namun memiliki koneksi lebih sedikit ke grup lain.
Clustering coefficient mengukur sejauh mana neighbors dari suatu node saling terhubung. Nilai mendekati 1 menunjukkan struktur seperti clique.
# Average clustering coefficient
avg_clustering = nx.average_clustering(G)
print(f"Average Clustering Coefficient: {avg_clustering:.3f}")

# Clustering per node
node_clustering = nx.clustering(G)
print("Clustering per node:", node_clustering)
Output:
Average Clustering Coefficient: 0.333
Clustering per node: {1: 0.3333333333333333, 2: 1.0, 3: 0.3333333333333333, 4: 0, 5: 0}
NetworkX juga menyediakan algoritma community detection. greedy_modularity_communities() menggunakan modularity maximization untuk mengidentifikasi communities.
from networkx.algorithms import community

# Community detection
communities = community.greedy_modularity_communities(G)
for i, comm in enumerate(communities):
    print(f"Community {i+1}: {sorted(comm)}")
Output:
Community 1: [1, 2, 3]
Community 2: [4, 5]
Path dan Connectivity
Analisis path penting untuk memahami keterhubungan dalam graph. Shortest path adalah jalur dengan jumlah edges minimal antara dua nodes.
# Shortest path
path = nx.shortest_path(G, source=1, target=4)
print(f"Shortest path from 1 to 4: {path}")

# Shortest path length
path_length = nx.shortest_path_length(G, source=1, target=4)
print(f"Path length: {path_length}")
Output:
Shortest path from 1 to 4: [1, 3, 4]
Path length: 2
NetworkX juga menghitung average shortest path length untuk seluruh graph, memberikan gambaran seberapa "dekat" nodes satu sama lain dalam jaringan tersebut.
# Average shortest path length (untuk connected graph)
if nx.is_connected(G):
    avg_path = nx.average_shortest_path_length(G)
    print(f"Average shortest path length: {avg_path:.3f}")
Output:
Average shortest path length: 1.400Aplikasi Praktis: Analisis Jaringan Sosial
Mari terapkan NetworkX untuk analisis sederhana jaringan sosial. Kita akan membuat graph representasi pertemanan dan menganalisis influence patterns.
# Membuat social network graph
social_net = nx.Graph()

# Menambahkan friendships
friendships = [
    ('Alice', 'Bob'), ('Alice', 'Carol'), ('Alice', 'David'),
    ('Bob', 'Carol'), ('Bob', 'Eve'),
    ('Carol', 'David'), ('Carol', 'Frank'),
    ('David', 'Eve'), ('David', 'Frank'),
    ('Eve', 'Frank'), ('Eve', 'Grace'),
    ('Frank', 'Grace'), ('Frank', 'Heidi'),
    ('Grace', 'Heidi')
]
social_net.add_edges_from(friendships)

# Analisis centrality
degree_cent = nx.degree_centrality(social_net)
betweenness_cent = nx.betweenness_centrality(social_net)

print("Top 3 by Degree Centrality:")
sorted_degree = sorted(degree_cent.items(), key=lambda x: x[1], reverse=True)[:3]
for person, score in sorted_degree:
    print(f"  {person}: {score:.3f}")

print("\nTop 3 by Betweenness Centrality:")
sorted_betweenness = sorted(betweenness_cent.items(), key=lambda x: x[1], reverse=True)[:3]
for person, score in sorted_betweenness:
    print(f"  {person}: {score:.3f}")
Output:
Top 3 by Degree Centrality:
  Frank: 0.714
  Carol: 0.571
  David: 0.571

Top 3 by Betweenness Centrality:
  Frank: 0.310
  Eve: 0.167
  Carol: 0.115
Hasil analisis menunjukkan nodes dengan degree centrality tinggi adalah social butterflies dengan banyak koneksi langsung. Nodes dengan betweenness centrality tinggi berperan sebagai broker atau connector antar subgroups.
Kesimpulan
NetworkX menyediakan foundation yang solid untuk graph analysis di Python. Library ini menangkap kompleksitas teori graph dalam API yang intuitive dan well-documented.
Kombinasi kemampuan NetworkX untuk membuat graph, menghitung metrics, dan mengidentifikasi patterns menjadikannya tools penting dalam toolkit Data Scientist. Mulai dari analisis jaringan sosial sampai optimasi supply chain, pemahaman graph structure membuka perspektif baru dalam data analysis.
Ingin memperdalam kemampuan Data Science? Bergabunglah dengan program lengkap di Rumah Coding dan pelajari analisis data, machine learning, serta teknik visualisasi dari praktisi berpengalaman.
Kursus Terkait

Data Science with Python
Master the art of data analysis, visualization, and predictive modeling.
E-commerce Sales Dashboard
- Data Cleaning Pipeline
- Interactive Charts
- Sales Forecasting Model

Deep Learning Bootcamp
A beginner-friendly, highly interactive bootcamp designed to take you from foundational concepts to deploying real-world Artificial Intelligence applications. Through a completely project-based approach, you will master the core of Deep Learning, Artificial Neural Networks, and Computer Vision using Python and TensorFlow, ultimately building a professional-grade AI web application for your portfolio.
GreenGuard: Intelligent Plant Disease Diagnosis Web App
- Interactive Image Upload UI: A clean, user-friendly interface built with Streamlit that supports drag-and-drop image uploads directly from a computer or mobile phone.
- Real-Time AI Inference: Utilizes a lightweight, optimized CNN model (like MobileNetV2) to process the image and return a diagnosis in seconds without heavy server load.
- Confidence Scoring Dashboard: Visually displays the model's prediction probability (e.g., "95% confident this is Tomato Late Blight") using interactive progress bars or charts.

LLM Bootcamp
This project-based bootcamp is designed for beginners to dive practically into the world of Large Language Models (LLMs). Through hands-on building, you will learn how to interact with top-tier AI APIs, master prompt engineering, orchestrate complex workflows using LangChain, and implement Retrieval-Augmented Generation (RAG) to query your own documents. By the end of this course, you will have the skills to build, test, and deploy a fully functional, custom AI web application.
Domain-Specific AI Knowledge Assistant
- Dynamic Document Processing: A sidebar interface allowing users to upload new PDF or TXT files, which the app automatically chunks, embeds, and stores in the vector database.
- Context-Aware Chat UI: A modern chat interface built with Streamlit that maintains conversation history, allowing users to ask follow-up questions naturally.
- Strict Guardrails (Anti-Hallucination): System instructions designed so the AI politely declines to answer questions that fall outside the context of the uploaded documents.
Artikel Terkait

Memahami Konsep Logistic Regression dan Implementasinya dengan Python untuk Klasifikasi Biner
Memahami Algoritma Random Forest dari Teori sampai Implementasi dengan Scikit-learn untuk Klasifikasi dan Regresi
